Tableau, Power BI, Qlik Sense, Google Data Studio, Holistics, Looker, SQL, Python, R… The field of data visualization may be quite intimidating for someone who just wants to get started and build some really cool dashboards. Like every field in tech, there is so much to learn, and worse, there is always a new tool, promising to change the way you do everything all over again
The good news is that you do not need to learn everything at once. In fact, you may not need to learn everything to be fit to build dashboards that clearly communicates your key goals and metrics.
- Start with Excel: For most people, the Microsoft Office Suite is familiar territory. Starting your visualization journey with Excel gives you a friendly interface with learning resources always readily available (here’s a good one). Excel has often been overlooked in the data visualization community but still remains a powerful tool for many professionals.

2. Pick a tool and own it: Now is the time to choose your weapon. The framework for most visualization tools are quite similar so after you become comfortable with one, adopting others won’t be such a herculean task. I personally recommend Google Data studio/ Power BI for starters. Here’s a detailed comparison of both tools. Choose wisely!
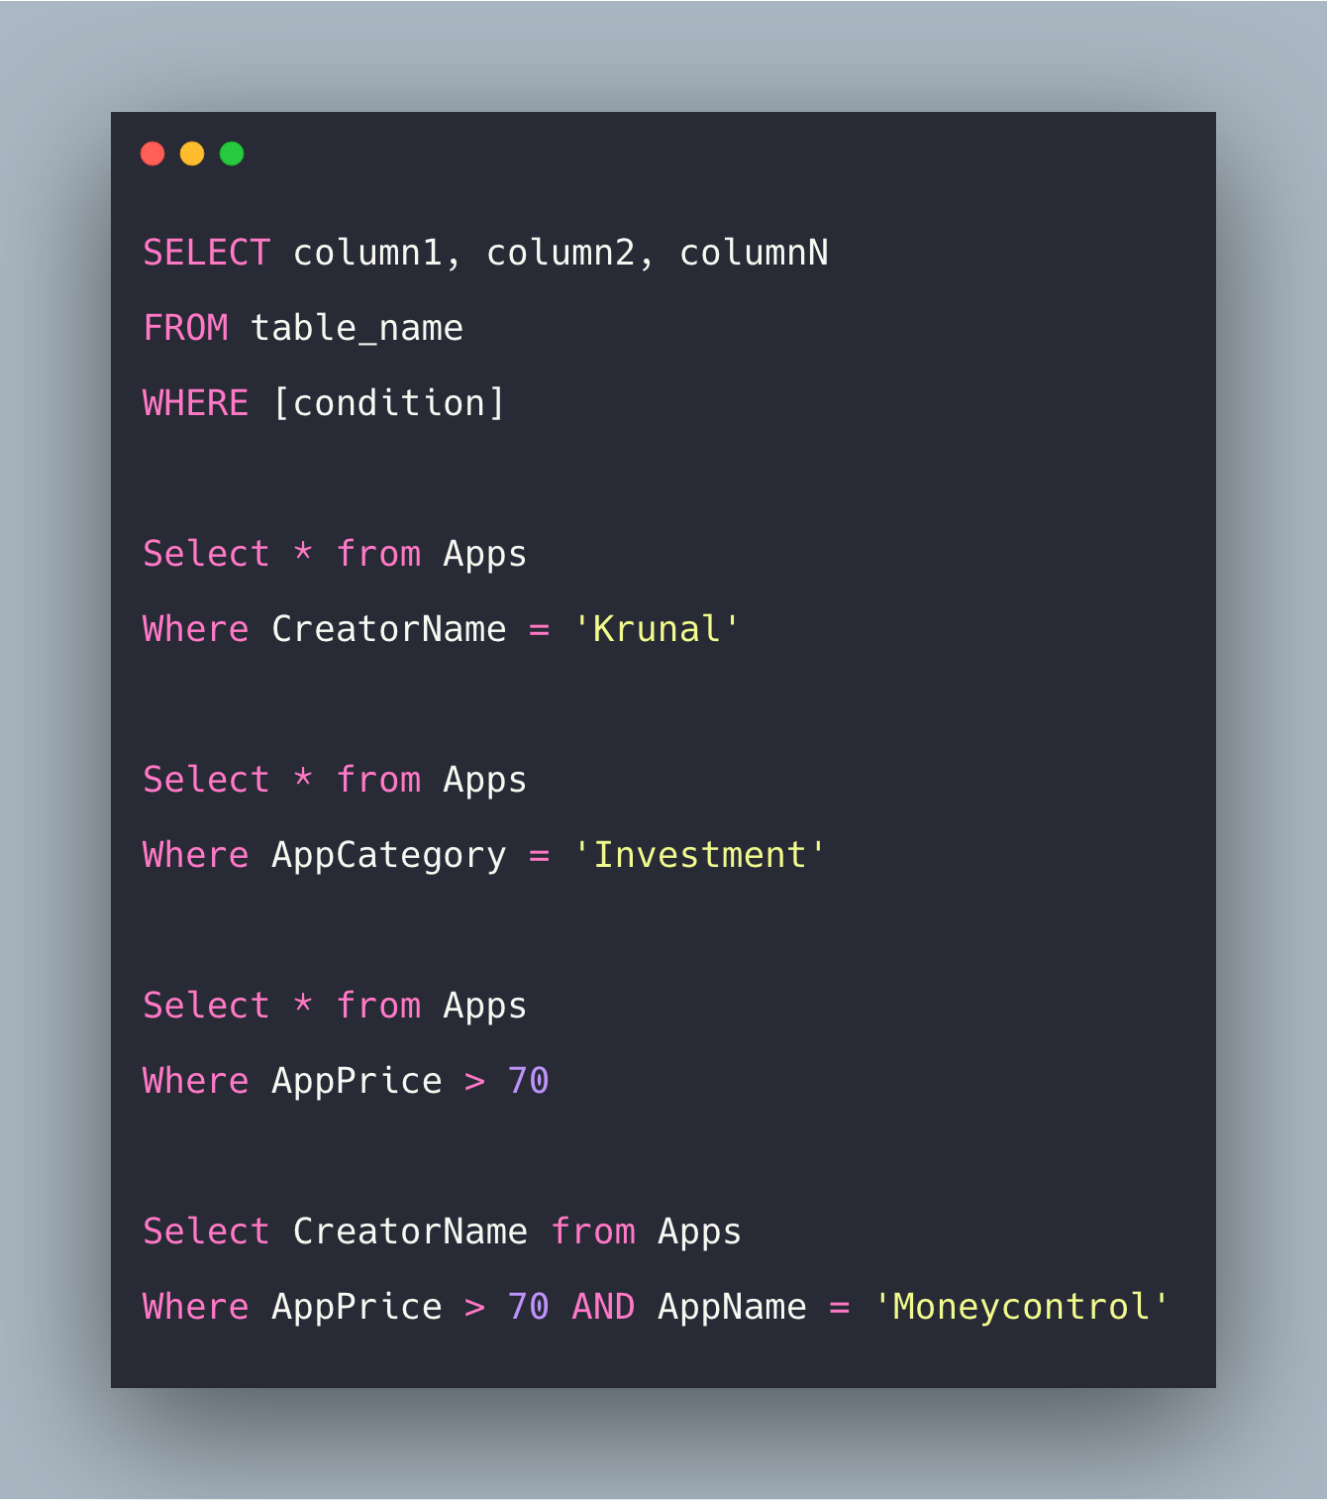
3. Learn SQL: You can’t build dashboards without data. SQL is a standard language for storing, manipulating, and retrieving data in databases. If you’re working on a team, you may be lucky to have someone extract your data for you but as you grow, you’ll see the need to extract, transform and load your data yourself. The simple SELECT, JOIN, and WHERE commands are enough to get you started and while a lot can be done in SQL without needing R or python, being able to program in Python or R becomes more important as job seniority increases so keep that in mind. W3Schools is a good place to get started when you’re ready
4. Join communities: So many valuable resources can be tapped through community networking and this has proven to be one of the fastest ways to grow your career in any field.
If I have seen a little further, it is by standing on the shoulders of giants
– Sir Isaac Newton
Now that you know the ropes, you’re ready to get into the more advanced territories of data visualization. Where you go from here depends on what field your passion and career points you to but regardless of what you choose, nothing should scare you again.
Welcome to the team. See you around!